A link to the GUI
The isoorbi functionalities have been extended into a web-based graphical user interface (GUI) that provides click-button access to analyze data quality and reduce the .isox data into a summary table of isotopocule ratios that can be downloaded as a spreadsheet. The demo version of the GUI can be found here: https://isoorbi.shinyapps.io/IsoXL.
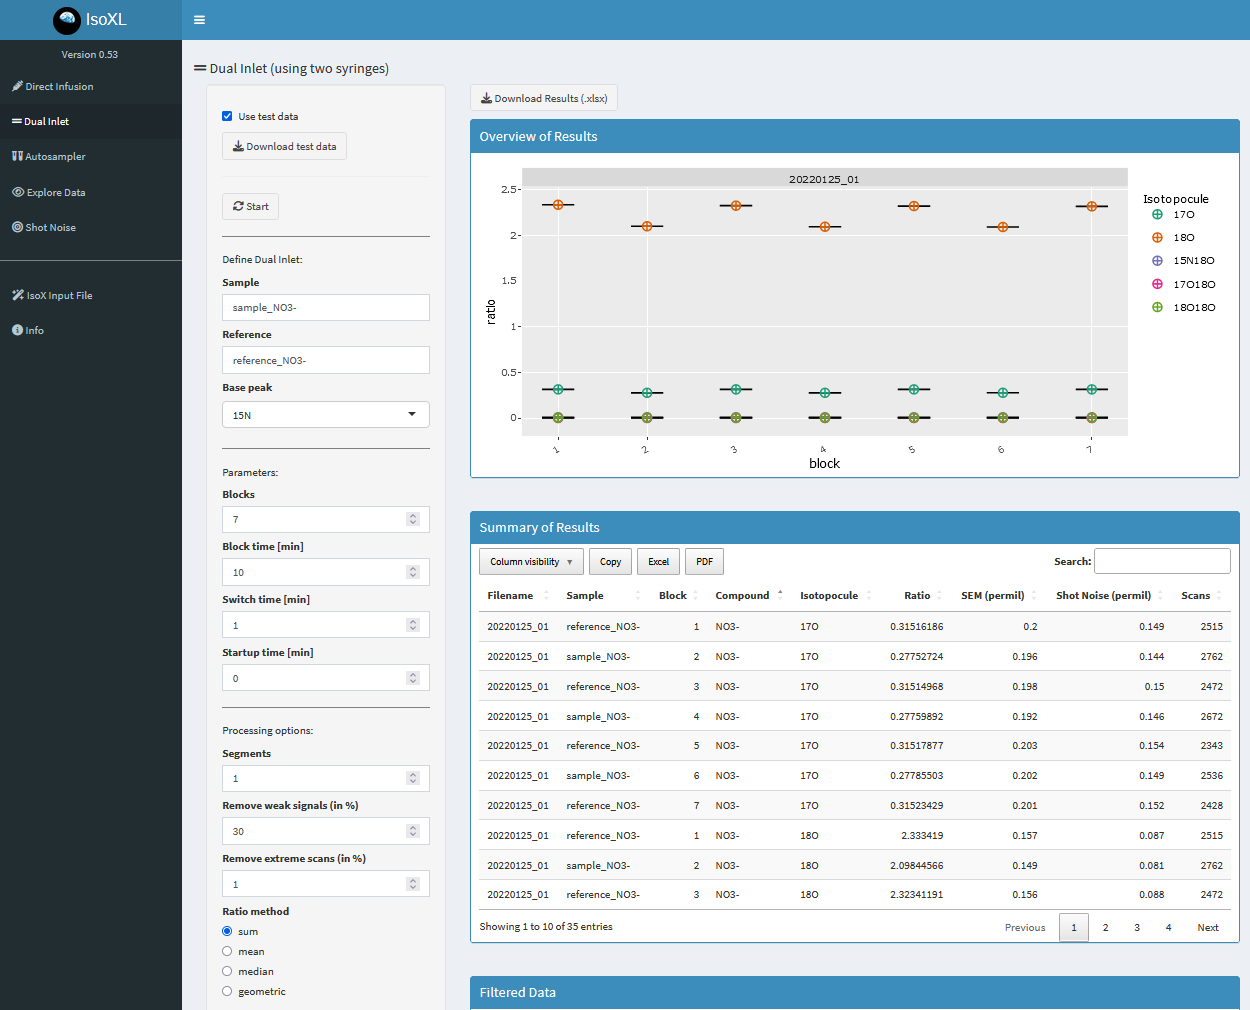
A screenshot of the IsoXL GUI.