
Skip to contents

Raw files differ in which information they provide depending on the instrument and its software version. orbi_aggregate_raw() therefore uses an aggregator that defines which information to pull out of the raw files, where to find it, and what data type it should have. This vignette shows how to use the included aggregators, how to build your own, and how to use a custom aggregator to retrieve information from the instrument status log.

# libraries
library(isoorbi) # load isoorbi R package
library(dplyr) # for mutating data frames
library(ggplot2) # for data visualization

Example files

Here we use two example files from two different instruments (an Orbitrap Exploris 240 and a Q Exactive Focus).

# two example files from different instruments
raw_files <-
  orbi_get_example_files(c("dual_inlet.raw", "s3744.RAW")) |>
  orbi_read_raw()
✔ [395ms] orbi_read_raw() read dual_inlet.raw from cache
✔ [84ms] orbi_read_raw() read s3744.RAW from cache
✔ [566ms] orbi_read_raw() finished reading 2 files
raw_files
──────────────── 2 raw files - combine with orbi_aggregate_raw() ───────────────
1. dual_inlet.raw has 12.3k scans with 185k peaks and 441 status log entries;
no spectra were loaded
2. s3744.RAW      has 5.49k scans with 155k peaks and 79 status log entries; no
spectra were loaded

Included aggregators

orbi_get_aggregator()

orbi_aggregate_raw() uses the standard aggregator by default. The minimal aggregator contains a smaller set of columns to aggregate. The extended aggregator is more elaborate, providing access to additional columns from the raw data files.

# example: minimal vs. extended aggregator
orbi_get_aggregator("minimal")
────────────────────────────── Aggregator minimal ──────────────────────────────
Dataset file_info:
 → filename = as.character(sub(FileName, pattern = "\\.raw$", replacement = "",
ignore.case = TRUE))
 → creation_date = as.POSIXct(CreationDate)
 → in_aquisition = as.logical(InAquisition)
Dataset scans:
 → scan.no = as.integer(scan.no)
 → time.min = as.numeric(StartTime)
 → tic = as.numeric(TIC)
 → it.ms = as.numeric(`Ion Injection Time (ms)`)
 → resolution = as.numeric(one_of(`FT Resolution`, `Orbitrap Resolution`))
 → microscans = as.integer(`Micro Scan Count`)
Dataset peaks:
 → scan.no = as.integer(scan.no)
 → mzMeasured = as.numeric(mass)
 → intensity = as.numeric(intensity)
 → baseline = as.numeric(baseline)
 → peakNoise = as.numeric(noise)
 → peakResolution = as.numeric(resolution)
 → centroiderFlags = as.factor(orbi_peak_flags_to_text(flags))
Dataset spectra:
 → scan.no = as.integer(scan.no)
 → mz = as.numeric(mass)
 → intensity = as.numeric(intensity)
────────────────────────────── Aggregator extended ─────────────────────────────
Dataset file_info:
 → filename = as.character(sub(FileName, pattern = "\\.raw$", replacement = "",
ignore.case = TRUE))
 → creation_date = as.POSIXct(CreationDate)
 → in_aquisition = as.logical(InAquisition)
 → (.*) = as.character(all_matches("(.*)"))
Dataset scans:
 → scan.no = as.integer(scan.no)
 → time.min = as.numeric(StartTime)
 → tic = as.numeric(TIC)
 → it.ms = as.numeric(`Ion Injection Time (ms)`)
 → resolution = as.numeric(one_of(`FT Resolution`, `Orbitrap Resolution`))
 → microscans = as.integer(`Micro Scan Count`)
 → basePeakMz = as.numeric(BasePeakMass)
 → basePeakIntensity = as.numeric(BasePeakIntensity)
 → lowMass = as.numeric(LowMass)
 → highMass = as.numeric(HighMass)
 → rawOvFtT = as.numeric(RawOvFtT)
 → intensCompFactor = as.numeric(`OT Intens Comp Factor`)
 → agc = as.character(AGC)
 → agcTarget = as.integer(`AGC Target`)
 → numberLockmassesFound = as.integer(`Number of LM Found`)
 → analyzerTemperature = as.numeric(`Analyzer Temperature`)
 → (.*) = as.character(all_matches("(.*)"))
Dataset peaks:
 → scan.no = as.integer(scan.no)
 → mzMeasured = as.numeric(mass)
 → intensity = as.numeric(intensity)
 → baseline = as.numeric(baseline)
 → peakNoise = as.numeric(noise)
 → peakResolution = as.numeric(resolution)
 → centroiderFlags = as.factor(orbi_peak_flags_to_text(flags))
Dataset spectra:
 → scan.no = as.integer(scan.no)
 → mz = as.numeric(mass)
 → intensity = as.numeric(intensity)
# using the extended aggregator instead of the default (standard)
raw_files |> orbi_aggregate_raw(aggregator = "extended")
✔ [979ms] orbi_aggregate_raw() aggregated file_info (2), scans (17.8k), peaks
(340k), spectra (0), and status_log (0) from 2 files using the extended
aggregator
─────── aggregated data from 2 raw files - retrieve with orbi_get_data() ───────
→ file_info (2): uidx, filepath, filename, creation_date, in_aquisition,
Operator, FileDescription, MassResolution, SpectraCount, FirstSpectrum,
LastSpectrum, StartTime, EndTime, LowMass, HighMass, InstrumentCount,
InstrumentModel, InstrumentName, SerialNumber, SoftwareVersion,
HardwareVersion, RawFileVersion, InstrumentUnits, Comment, SampleId,
SampleName, SampleType, SampleWeight, SampleVolume, Barcode, RowNumber, Vial,
InjectionVolume, DilutionFactor, IstdAmount, CalibrationLevel,
InstrumentMethodFile, CalibrationFile, ProcessingMethodFile, UserText0,
UserText1, UserText2, UserText3, UserText4
→ scans (17.8k): uidx, scan.no, time.min, tic, it.ms, resolution, microscans,
basePeakMz, basePeakIntensity, lowMass, highMass, rawOvFtT, intensCompFactor
(5.49k NA), agc, agcTarget, numberLockmassesFound, analyzerTemperature,
IsCentroidScan, ScanType, Scan Description (5.49k NA), Multiple Injection,
Multi Inject Info, Scan Segment, Scan Event, Master Index, Master Scan Number
(5.49k NA), Charge State, Monoisotopic M/Z, Error in isotopic envelope fit
(5.49k NA), Max. Ion Time (ms), MS2 Isolation Width, MS2 Isolation Offset, HCD
Energy, HCD Energy V (5.49k NA), === Mass Calibration: ===, Conversion
Parameter B, Conversion Parameter C, Temperature Comp. (ppm), RF Comp. (ppm),
Space Charge Comp. (ppm), Resolution Comp. (ppm), Number of Lock Masses, Lock
Mass #1 (m/z), Lock Mass #2 (m/z), Lock Mass #3 (m/z), LM Search Window (ppm),
LM Search Window (mmu), Last Locking (sec), LM m/z-Correction (ppm), === Ion
Optics Settings: ===, S-Lens RF Level, ==== Diagnostic Data: ====, Application
Mode (5.49k NA), Mild Trapping Mode (5.49k NA), APD (5.49k NA), Res. Dep.
Intens, Q Trans Comp (5.49k NA), PrOSA NumF (5.49k NA), PrOSA Comp (5.49k NA),
PrOSA ScScr (5.49k NA), Dynamic RT Shift (min), LC FWHM parameter, PS Inj. Time
(ms), AGC PS Mode, AGC PS Diag, AGC Target Adjust (5.49k NA), AGC Diag 1 (5.49k
NA), AGC Diag 2 (5.49k NA), HCD abs. Offset (5.49k NA), Source CID eV (5.49k
NA), AGC Fill, Injection t0, t0 FLP, Iso Para R (5.49k NA), Inj Para R (5.49k
NA), Access Id, Analog In A (V) (5.49k NA), Analog In B (V) (5.49k NA), FAIMS
Attached (5.49k NA), FAIMS Voltage On (5.49k NA), FAIMS CV (5.49k NA), S-Lens
Voltage (V) (12.3k NA), Skimmer Voltage (V) (12.3k NA), Inject Flatapole Offset
(V) (12.3k NA), Bent Flatapole DC (V) (12.3k NA), MP2 and MP3 RF (V) (12.3k
NA), Gate Lens Voltage (V) (12.3k NA), C-Trap RF (V) (12.3k NA), Intens Comp
Factor (12.3k NA), CTCD NumF (12.3k NA), CTCD Comp (12.3k NA), CTCD ScScr
(12.3k NA), Rod (12.3k NA), HCD Energy eV (12.3k NA), Analog Input 1 (V) (12.3k
NA), Analog Input 2 (V) (12.3k NA)
→ peaks (340k): uidx, scan.no, mzMeasured, intensity, baseline, peakNoise,
peakResolution, centroiderFlags
→ spectra (0): uidx, scan.no, mz, intensity
→ status_log (0): nothing aggregated; not aggregated: 236 columns → to show all
use: print(x, show_all = TRUE)
→ problems: has no issues

The printout of the aggregated data only says how many columns of each dataset were not aggregated. To see which ones they are (e.g. to find additional information to include in a custom aggregator), print the aggregated data with show_all = TRUE.

agg_data <- raw_files |> orbi_aggregate_raw()
✔ [450ms] orbi_aggregate_raw() aggregated file_info (2), scans (17.8k), peaks
(340k), spectra (0), and status_log (0) from 2 files using the standard
aggregator
agg_data |> print(show_all = TRUE)
─────── aggregated data from 2 raw files - retrieve with orbi_get_data() ───────
→ file_info (2): uidx, filepath, filename, creation_date, in_aquisition,
Operator, FileDescription, MassResolution, SpectraCount, FirstSpectrum,
LastSpectrum, StartTime, EndTime, LowMass, HighMass, InstrumentCount,
InstrumentModel, InstrumentName, SerialNumber, SoftwareVersion,
HardwareVersion, RawFileVersion, InstrumentUnits, Comment, SampleId,
SampleName, SampleType, SampleWeight, SampleVolume, Barcode, RowNumber, Vial,
InjectionVolume, DilutionFactor, IstdAmount, CalibrationLevel,
InstrumentMethodFile, CalibrationFile, ProcessingMethodFile, UserText0,
UserText1, UserText2, UserText3, UserText4
→ scans (17.8k): uidx, scan.no, time.min, tic, it.ms, resolution, microscans,
basePeakMz, basePeakIntensity, lowMass, highMass, rawOvFtT, intensCompFactor
(5.49k NA), agc, agcTarget, numberLockmassesFound, analyzerTemperature; not
aggregated: IsCentroidScan, ScanType, Scan Description, Multiple Injection,
Multi Inject Info, Scan Segment, Scan Event, Master Index, Master Scan Number,
Charge State, Monoisotopic M/Z, Error in isotopic envelope fit, Max. Ion Time
(ms), MS2 Isolation Width, MS2 Isolation Offset, HCD Energy, HCD Energy V, ===
Mass Calibration: ===, Conversion Parameter B, Conversion Parameter C,
Temperature Comp. (ppm), RF Comp. (ppm), Space Charge Comp. (ppm), Resolution
Comp. (ppm), Number of Lock Masses, Lock Mass #1 (m/z), Lock Mass #2 (m/z),
Lock Mass #3 (m/z), LM Search Window (ppm), LM Search Window (mmu), Last
Locking (sec), LM m/z-Correction (ppm), === Ion Optics Settings: ===, S-Lens RF
Level, ==== Diagnostic Data: ====, Application Mode, Mild Trapping Mode, APD,
Res. Dep. Intens, Q Trans Comp, PrOSA NumF, PrOSA Comp, PrOSA ScScr, Dynamic RT
Shift (min), LC FWHM parameter, PS Inj. Time (ms), AGC PS Mode, AGC PS Diag,
AGC Target Adjust, AGC Diag 1, AGC Diag 2, HCD abs. Offset, Source CID eV, AGC
Fill, Injection t0, t0 FLP, Iso Para R, Inj Para R, Access Id, Analog In A (V),
Analog In B (V), FAIMS Attached, FAIMS Voltage On, FAIMS CV, S-Lens Voltage
(V), Skimmer Voltage (V), Inject Flatapole Offset (V), Bent Flatapole DC (V),
MP2 and MP3 RF (V), Gate Lens Voltage (V), C-Trap RF (V), Intens Comp Factor,
CTCD NumF, CTCD Comp, CTCD ScScr, Rod, HCD Energy eV, Analog Input 1 (V),
Analog Input 2 (V)
→ peaks (340k): uidx, scan.no, mzMeasured, intensity, baseline, peakNoise,
peakResolution, centroiderFlags
→ spectra (0): uidx, scan.no, mz, intensity
→ status_log (0): nothing aggregated; not aggregated: log.no, StartTime, ====
FAIMS Device: ====, ==== Overall Status: ====, Status, Performance, ====== Ion
Source: ======, Spray Voltage (V), Spray Current (µA), Spray Current std. dev.
(µA), Ion Transfer Tube Temperature (°C), Sheath gas pressure (psi), Aux gas
pressure (psi), Sweep gas pressure (psi), Vaporizer Temperature (°C), ======
Ion Optics: ======, CTB: C-trap RF freq. (MHz), CTB: C-trap RF amp. (MHz), CTB:
Quad. exit lens (V), CTB: Beam split lens (V), CTB: Tr. multipole DC (V), CTB:
C-trap entr. lens (V), CTB: C-trap exit lens (V), CTB: Z lens (V), CTB: HCD ax.
field entr. (V), CTB: HCD ax. field exit (V), CTB: HCD exit lens (V), QS: Quad.
RF amp. (Vpp), QS: Quad. MSeg rod A DC (V), QS: Quad. MSeg rod B DC (V), SB:
Spray HV voltage (V), SB: Spray HV current (uA), IOB: Source DC (V), IOB:
S-Lens RF amp. (Vpp), IOB: S-Lens RF freq. (kHz), IOB: Inj. fl. phase A DC (V),
IOB: Inj. fl. phase B DC (V), IOB: Inj. fl. RF amp. (Vpp), IOB: Inj. fl. RF
freq. (kHz), IOB: Inj. fl. RF curr. (A), IOB: Fl. focus lens (V), IOB: Bent fl.
DC (V), IOB: Bent fl. ax. f. e. (V), IOB: Bent fl. exit lens (V), IOB: Bent fl.
RF amp. (Vpp), IOB: Bent fl. RF freq. (kHz), PCBAOS: C-trap inj. o. + (V),
PCBAOS: C-trap inj. o. - (V), PCBAOS: HV focus lens (V), PCBAOS: V lens (V),
PCBAOS: Defl. measure + (V), PCBAOS: Defl. measure - (V), PCBAOS: CE inject +
(V), PCBAOS: CE inject - (V), ===== Temperatures: =====, Ambient temp. (°C),
Orbitrap block temp. (°C), Detector temp. (°C), Ion tr. tube temp. (°C),
Vaporizer temp. (°C), CPU core temp. (°C), PCB temp. top (°C), PCB temp. center
(°C), PCB temp. bottom (°C), ==== Diagnostic Data: ====, Performance ld,
Performance me, Performance cy, PrOSA counts, PrOSA blank, PrOSA time (us),
PrOSA curr (pA), ICB: Up-time (sec), ICB: +24 V, ICB: +5 V, ICB: +3.3 V, ICB:
+2.5 V, ICB: +1.2 V, ICB: Power-on time (h), ICB: Acc. bakeout time (h), ICB:
Turbopump speed (Hz), ICB: Turbopump power (W), ICB: Turbopump error state,
ICB: Turbopump last error, ICB: UHV pres. (mbar), ICB: HCD cell pres. (mbar),
ICB: Fore-vac. pres. (mbar), ICB: IF region pres. (mbar), ICB: R-f fan speed
(rpm), ICB: L-b fan speed (rpm), ICB: L-f fan speed (rpm), ICB: Dig. I/O start
0, ICB: Dig. I/O start 1, ICB: OSPI ERR queue usage, DAQ: Voltage monitor, DAQ:
Status register, CTB: FAN1 speed (rpm), CTB: FAN2 speed (rpm), CTB: ICD integr.
active, CTB: ICD signal count (ct), CTB: ICD blank count (ct), CTB: ICD ion
inj. time (us), CTB: C-trap RF curr. (mA), CTB: C-trap RF s. volt. (V), CTB: HV
positive (V), CTB: HV negative (V), QS: HV negative (V), QS: HV positive (V),
SB: +24 V supply, SB: +15 V analog supply, SB: -8 V supply, SB: +5 V analog
supply, SB: +5 V digital supply, SB: -5 V analog supply, SB: +3.3 V digital
supply, SB: +2.5 V digital supply, SB: +1.2 V digital supply, SB: Ion tr. tube
fuse, SB: Ion tr. tube temp. OOR, SB: Ion tr. tube voltage (V), SB: Vaporizer
fuse, SB: Vaporizer temp. OOR, SB: 8 kV const. volt./c.m., SB: Valve fuse, SB:
Aux. gas pres. (psi), SB: Sheath gas pres. (psi), SB: Sweep gas pres. (psi),
SB: Interlock fuse, SB: Switch 1 closed, SB: Relay 1 closed, SB: Switch 2
closed, SB: Relay 2 closed, SB: Interlock switch, SB: Cover is taken off, SB:
ICS/ETD available, IOB: HV fuse, IOB: RF fuse, IOB: HVV positive (V), IOB: HVV
negative (V), IOB: HV positive (V), IOB: HV negative (V), FTPCU: CPU load
average, FTPCU: Board free RAM, PCBAOS: HV monitor (kV), PCBAOS: R_Pulser_CE
(V), PCBAOS: R_Pulser_DE (V), ==== FAIMS Device: ==== (2), Attached, Dispersion
Voltage (DV), Compensation Voltage (CV), Entrance Plate Voltage (V), Total
Carrier Gas Flow (lpm), Cooling Gas Flow (lpm), Gas Pressure (psi), Cooling Gas
Pressure (psi), Input Gas Pressure (psi), Inner Electrode Temp. (°C), Outer
Electrode 1 Temp. (°C), Outer Electrode 2 Temp. (°C), MCB Ambient Temp. (°C),
MCB Atmosph. Pressure (kPa), DV High Frequency Amp. (V), DV Low Frequency Amp.
(V), DV Phase (°), DV Frequency (Hz), System Voltage (V), System Current (A),
Relays (+24V), +6.25D (V), -6.25D (V), +5A (V), -5A (V), +3.0D (V), +1.8A (V),
+3.3D (V), MCB PCB Temp. (°C), RTD Reference (+3V), System Relay Voltage (V),
MCB Fan 1 Speed (Hz), MCB Fan 2 Speed (Hz), TXB Fan Speed (Hz), Outer Elec.
Bias Volt. (V), HF RF Amp Output Current (A), HF RF Supply Voltage (V), HF RF
Supply Current (A), LF RF Amp Output Current (A), LF RF Supply Voltage (V), LF
RF Supply Current (A), HF RF Amp Output Voltage (V), LF RF Amp Output Voltage
(V), TX PCB temperature (°C), DV High Frequency RF DAC (V), DV Low Frequency RF
DAC (V), MS Interlock 1 (V), MS Interlock 2 (V), Gate Drive Supply (V), ==
Collaborator Interface =, Custom Interface, Capillary Temperature (°C), Sheath
gas flow rate, Aux gas flow rate, Sweep gas flow rate, Aux. Temperature (°C),
Capillary Voltage (V), Bent Flatapole DC (V), Inj Flatapole DC (V), Trans
Multipole DC (V), HCD Multipole DC (V), RF0 and RF1 Amp (V), RF0 and RF1 Freq
(kHz), RF2 and RF3 Amp (V), RF2 and RF3 Freq (kHz), Inter Flatapole DC (V),
Quad Exit DC (V), C-Trap Entrance Lens DC (V), C-Trap RF Amp (V), C-Trap RF
Freq (kHz), C-Trap RF Curr (A), C-Trap Exit Lens DC (V), HCD Exit Lens DC (V),
====== Vacuum: ======, Fore Vacuum Sensor (mbar), High Vacuum Sensor (mbar),
UHV Sensor (mbar), Source TMP Speed, UHV TMP Speed, Analyzer Temperature (°C),
Ambient Temperature (°C), Ambient Humidity (%), Source TMP Motor Temperature
(°C), Source TMP Bottom Temperature (°C), UHV TMP Motor Temperature (°C), IOS
Heatsink Temp. (°C), HVPS Peltier Temp. (°C), Quad. Det. Temp. (°C), CTCD mV
→ problems: has no issues

Custom aggregators

orbi_register_aggregator()

You can build your own aggregator with orbi_start_aggregator() and/or expand an existing one with orbi_add_to_aggregator() and then register it via orbi_register_aggregator() to use it by name.

my_agg <-
  orbi_get_aggregator("minimal") |>
  # pull out the S-Lens RF Level information from the scans and store it as a number
  orbi_add_to_aggregator(
    "scans",
    "slens_rf",
    source = "S-Lens RF Level",
    cast = "as.numeric"
  ) |>
  orbi_register_aggregator(name = "custom")

# show my aggregator
my_agg
────────────────────────────── Aggregator minimal ──────────────────────────────
Dataset file_info:
 → filename = as.character(sub(FileName, pattern = "\\.raw$", replacement = "",
ignore.case = TRUE))
 → creation_date = as.POSIXct(CreationDate)
 → in_aquisition = as.logical(InAquisition)
Dataset scans:
 → scan.no = as.integer(scan.no)
 → time.min = as.numeric(StartTime)
 → tic = as.numeric(TIC)
 → it.ms = as.numeric(`Ion Injection Time (ms)`)
 → resolution = as.numeric(one_of(`FT Resolution`, `Orbitrap Resolution`))
 → microscans = as.integer(`Micro Scan Count`)
 → slens_rf = as.numeric(`S-Lens RF Level`)
Dataset peaks:
 → scan.no = as.integer(scan.no)
 → mzMeasured = as.numeric(mass)
 → intensity = as.numeric(intensity)
 → baseline = as.numeric(baseline)
 → peakNoise = as.numeric(noise)
 → peakResolution = as.numeric(resolution)
 → centroiderFlags = as.factor(orbi_peak_flags_to_text(flags))
Dataset spectra:
 → scan.no = as.integer(scan.no)
 → mz = as.numeric(mass)
 → intensity = as.numeric(intensity)
# use it
raw_files |> orbi_aggregate_raw(aggregator = "custom")
✔ [212ms] orbi_aggregate_raw() aggregated file_info (2), scans (17.8k), peaks
(340k), spectra (0), and status_log (0) from 2 files using the custom
aggregator
─────── aggregated data from 2 raw files - retrieve with orbi_get_data() ───────
→ file_info (2): uidx, filepath, filename, creation_date, in_aquisition; not
aggregated: 39 columns → to show all use: print(x, show_all = TRUE)
→ scans (17.8k): uidx, scan.no, time.min, tic, it.ms, resolution, microscans,
slens_rf; not aggregated: 88 columns → to show all use: print(x, show_all =
TRUE)
→ peaks (340k): uidx, scan.no, mzMeasured, intensity, baseline, peakNoise,
peakResolution, centroiderFlags
→ spectra (0): uidx, scan.no, mz, intensity
→ status_log (0): nothing aggregated; not aggregated: 236 columns → to show all
use: print(x, show_all = TRUE)
→ problems: has no issues

Instrument status log

Besides the scans, raw files hold the instrument’s status log: readbacks that the instrument records independently of the scans (typically every few seconds) such as temperatures, pressures, voltages, and ion source settings. orbi_read_raw() returns it as the status_log dataset.

# the raw status log of the first file (one row per log entry, one column per channel)
raw_files$status_log[[1]]
# A tibble: 441 × 198
   log.no StartTime `====  FAIMS Device:  ====` ====  Overall Status:  …¹ Status
    <int>     <dbl> <chr>                       <chr>                     <chr> 
 1      1   0.00693 ""                          ""                        Instr…
 2      2   0.177   ""                          ""                        Instr…
 3      3   0.347   ""                          ""                        Instr…
 4      4   0.517   ""                          ""                        Instr…
 5      5   0.687   ""                          ""                        Instr…
 6      6   0.858   ""                          ""                        Instr…
 7      7   1.03    ""                          ""                        Instr…
 8      8   1.20    ""                          ""                        Instr…
 9      9   1.37    ""                          ""                        Instr…
10     10   1.54    ""                          ""                        Instr…
# ℹ 431 more rows
# ℹ abbreviated name: ¹​`====  Overall Status:  ====`
# ℹ 193 more variables: Performance <chr>, `======  Ion Source:  ======` <chr>,
#   `Spray Voltage (V)` <chr>, `Spray Current (µA)` <chr>,
#   `Spray Current std. dev. (µA)` <chr>,
#   `Ion Transfer Tube Temperature (°C)` <chr>,
#   `Sheath gas pressure (psi)` <chr>, `Aux gas pressure (psi)` <chr>, …

Which channels a status log contains depends entirely on the instrument, so none of the included aggregators take anything from it. Instead, orbi_aggregate_raw() reports all of the status log channels as not aggregated (see print(agg_data, show_all = TRUE) above) so you can pick the ones you are interested in.

Status log aggregator

The status log stores all channel values as text (exactly as the instrument reports them), so the aggregator needs to cast the channels you want to use to numbers. Because different instruments can call the same channel by different names, you can provide the alternative names as the source and the aggregator uses whichever one exists in each file. Channels that a file does not have at all are left empty (NA) for that file.

status_agg <-
  orbi_get_aggregator("standard") |>
  # when each status log entry was recorded
  orbi_add_to_aggregator(
    "status_log",
    "time.min",
    source = "StartTime",
    cast = "as.numeric"
  ) |>
  # ion source
  orbi_add_to_aggregator(
    "status_log",
    "spray_voltage.V",
    source = "Spray Voltage (V)",
    cast = "as.numeric"
  ) |>
  orbi_add_to_aggregator(
    "status_log",
    "spray_current.uA",
    source = "Spray Current (µA)",
    cast = "as.numeric"
  ) |>
  # temperatures (some channels have different names on the two instruments)
  orbi_add_to_aggregator(
    "status_log",
    "ambient_temp.C",
    source = c("Ambient temp. (°C)", "Ambient Temperature (°C)"),
    cast = "as.numeric"
  ) |>
  orbi_add_to_aggregator(
    "status_log",
    "orbitrap_temp.C",
    source = c("Orbitrap block temp. (°C)", "Analyzer Temperature (°C)"),
    cast = "as.numeric"
  ) |>
  orbi_add_to_aggregator(
    "status_log",
    "detector_temp.C",
    source = "Detector temp. (°C)",
    cast = "as.numeric"
  ) |>
  # gas pressures
  orbi_add_to_aggregator(
    "status_log",
    "sheath_gas.psi",
    source = "SB: Sheath gas pres. (psi)",
    cast = "as.numeric"
  ) |>
  orbi_add_to_aggregator(
    "status_log",
    "aux_gas.psi",
    source = "SB: Aux. gas pres. (psi)",
    cast = "as.numeric"
  ) |>
  orbi_register_aggregator("standard with status log")

# show summary
status_agg
────────────────────────────── Aggregator standard ─────────────────────────────
Dataset file_info:
 → filename = as.character(sub(FileName, pattern = "\\.raw$", replacement = "",
ignore.case = TRUE))
 → creation_date = as.POSIXct(CreationDate)
 → in_aquisition = as.logical(InAquisition)
 → (.*) = as.character(all_matches("(.*)"))
Dataset scans:
 → scan.no = as.integer(scan.no)
 → time.min = as.numeric(StartTime)
 → tic = as.numeric(TIC)
 → it.ms = as.numeric(`Ion Injection Time (ms)`)
 → resolution = as.numeric(one_of(`FT Resolution`, `Orbitrap Resolution`))
 → microscans = as.integer(`Micro Scan Count`)
 → basePeakMz = as.numeric(BasePeakMass)
 → basePeakIntensity = as.numeric(BasePeakIntensity)
 → lowMass = as.numeric(LowMass)
 → highMass = as.numeric(HighMass)
 → rawOvFtT = as.numeric(RawOvFtT)
 → intensCompFactor = as.numeric(`OT Intens Comp Factor`)
 → agc = as.character(AGC)
 → agcTarget = as.integer(`AGC Target`)
 → numberLockmassesFound = as.integer(`Number of LM Found`)
 → analyzerTemperature = as.numeric(`Analyzer Temperature`)
Dataset peaks:
 → scan.no = as.integer(scan.no)
 → mzMeasured = as.numeric(mass)
 → intensity = as.numeric(intensity)
 → baseline = as.numeric(baseline)
 → peakNoise = as.numeric(noise)
 → peakResolution = as.numeric(resolution)
 → centroiderFlags = as.factor(orbi_peak_flags_to_text(flags))
Dataset spectra:
 → scan.no = as.integer(scan.no)
 → mz = as.numeric(mass)
 → intensity = as.numeric(intensity)
Dataset status_log:
 → time.min = as.numeric(StartTime)
 → spray_voltage.V = as.numeric(`Spray Voltage (V)`)
 → spray_current.uA = as.numeric(`Spray Current (µA)`)
 → ambient_temp.C = as.numeric(one_of(`Ambient temp. (°C)`, `Ambient
Temperature (°C)`))
 → orbitrap_temp.C = as.numeric(one_of(`Orbitrap block temp. (°C)`, `Analyzer
Temperature (°C)`))
 → detector_temp.C = as.numeric(`Detector temp. (°C)`)
 → sheath_gas.psi = as.numeric(`SB: Sheath gas pres. (psi)`)
 → aux_gas.psi = as.numeric(`SB: Aux. gas pres. (psi)`)
# aggregate with the status log aggregator
status_agg_data <- raw_files |>
  orbi_aggregate_raw(aggregator = "standard with status log")
✔ [527ms] orbi_aggregate_raw() aggregated file_info (2), scans (17.8k), peaks
(340k), spectra (0), and status_log (520) from 2 files using the standard with
status log aggregator

Visualizing the status log

Status log data is a great way to check on the instrument conditions during an analysis, for example to see whether the ion source and the temperatures were stable.

# retrieve the status log channels
status_log <- status_agg_data |>
  orbi_get_data(file_info = "filename", status_log = everything())
✔ [7ms] orbi_get_data() retrieved 520 records from the combination of file_info
(2) and status_log (520) via uidx
status_log
# A tibble: 520 × 10
    uidx filename   time.min spray_voltage.V spray_current.uA ambient_temp.C
   <int> <chr>         <dbl>           <dbl>            <dbl>          <dbl>
 1     1 dual_inlet  0.00693           2484.           0.0906           30.9
 2     1 dual_inlet  0.177             2461.           0.0937           30.9
 3     1 dual_inlet  0.347             2461.           0.0937           30.9
 4     1 dual_inlet  0.517             2461.           0.0999           30.8
 5     1 dual_inlet  0.687             2461.           0.0906           30.8
 6     1 dual_inlet  0.858             2461.           0.0968           30.8
 7     1 dual_inlet  1.03              2461.           0.0968           30.8
 8     1 dual_inlet  1.20              2461.           0.0999           30.8
 9     1 dual_inlet  1.37              2461.           0.0906           30.8
10     1 dual_inlet  1.54              2461.           0.0968           30.8
# ℹ 510 more rows
# ℹ 4 more variables: orbitrap_temp.C <dbl>, detector_temp.C <dbl>,
#   sheath_gas.psi <dbl>, aux_gas.psi <dbl>
# bring the channels into long format for plotting them in panels
status_log |>
  tidyr::pivot_longer(
    cols = -c("uidx", "filename", "time.min"),
    names_to = "channel"
  ) |>
  # channels in the order they were defined in the aggregator
  mutate(channel = factor(channel, levels = unique(channel))) |>
  # filter out channels a file does not have
  filter(!is.na(value)) |>
  ggplot() +
  aes(x = time.min, y = value) +
  geom_line() +
  facet_grid(channel ~ filename, scales = "free") +
  labs(x = "time [min]", y = NULL) +
  theme_bw()
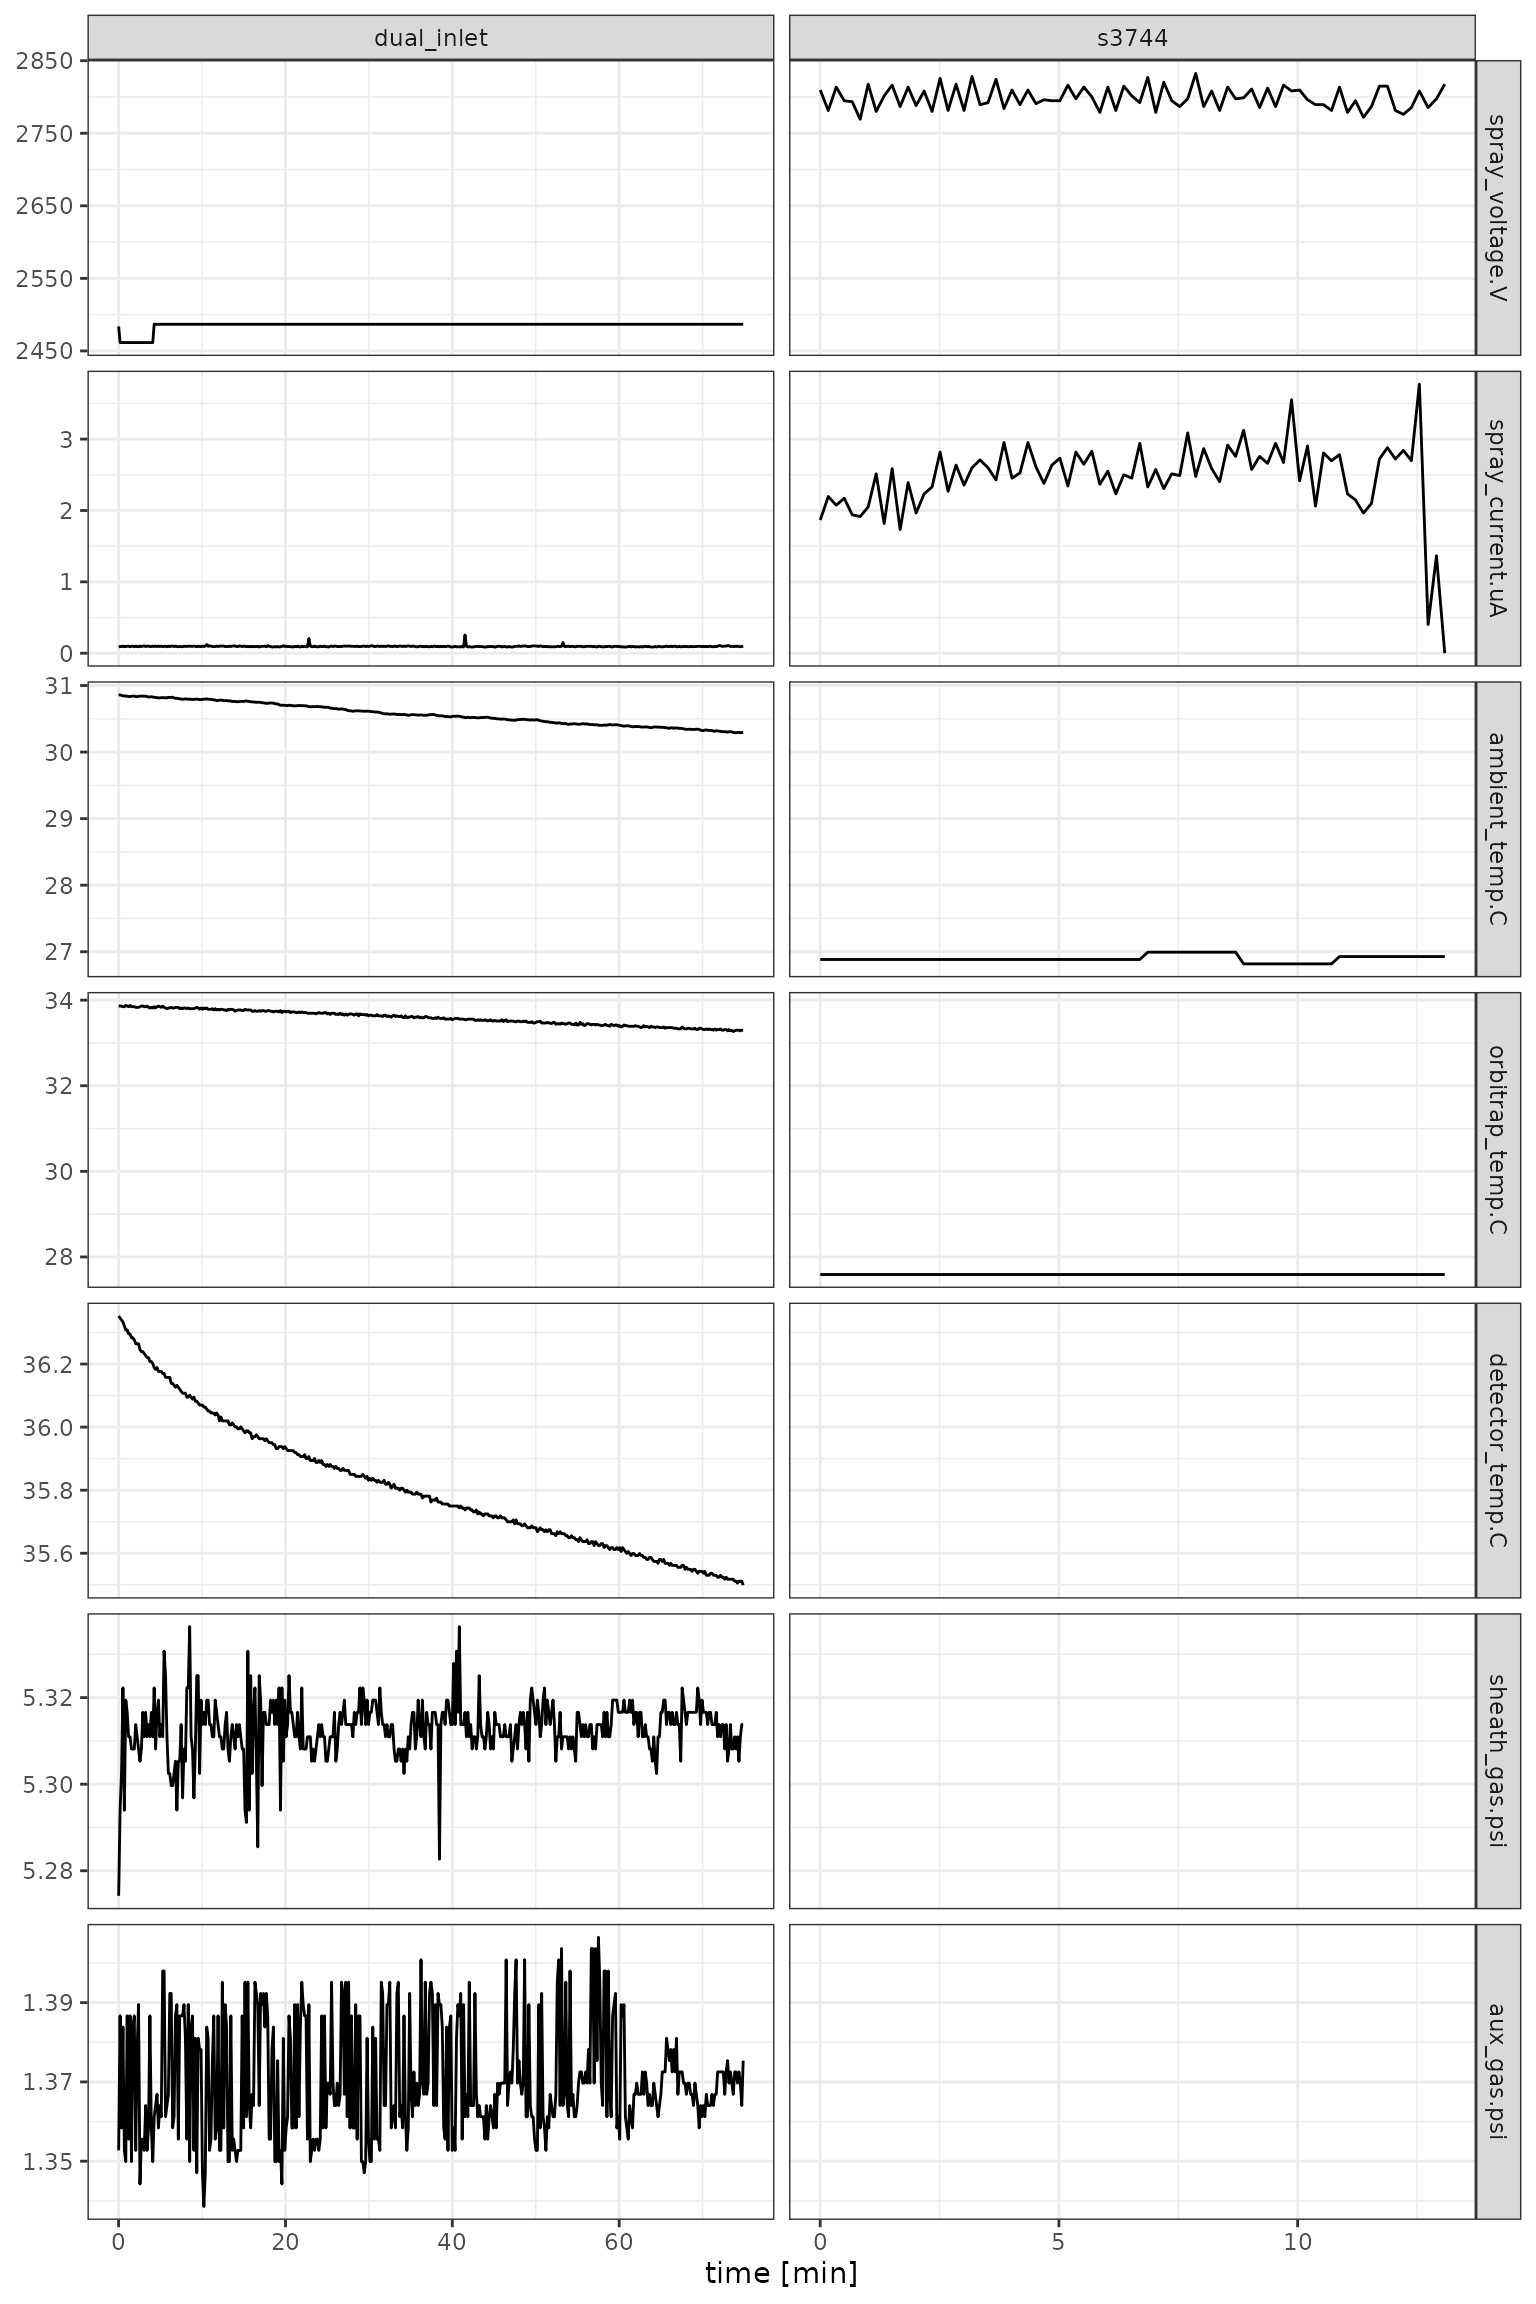
Ion source settings, temperatures, and gas pressures recorded in the status logs of the two files.

Ion source settings, temperatures, and gas pressures recorded in the status logs of the two files.

Comparison with the scans

The scans also record the temperature of the Orbitrap analyzer (analyzerTemperature, aggregated by the standard aggregator), so we can compare it with the temperatures in the status log: the ambient temperature, the Orbitrap block (analyzer) temperature, and the detector temperature. Note that the analyzer temperature in the scans is not identical to the Orbitrap temperature in the status log: it is not as precise and differs from the status log readback by up to ~0.2 °C in these files. In the longer run below (dual_inlet), it behaves like a strongly smoothed version of the status log’s Orbitrap block temperature that lags behind its changes. The differences stem likely from temperature data recorded with different sensors/circuit boards.

# temperatures from the status log
temps <- status_agg_data |>
  orbi_get_data(
    file_info = "filename",
    status_log = c(
      "time.min",
      "ambient" = "ambient_temp.C",
      "Orbitrap" = "orbitrap_temp.C",
      "detector" = "detector_temp.C"
    )
  ) |>
  tidyr::pivot_longer(
    cols = c("ambient", "Orbitrap", "detector"),
    names_to = "temperature",
    values_to = "temperature.C"
  ) |>
  mutate(data_source = "status log") |>
  # the analyzer (Orbitrap) temperature from the scans
  bind_rows(
    status_agg_data |>
      orbi_get_data(
        file_info = "filename",
        scans = c("time.min", "temperature.C" = "analyzerTemperature")
      ) |>
      mutate(temperature = "Orbitrap", data_source = "scans")
  ) |>
  # temperatures a file does not have
  filter(!is.na(temperature.C))
✔ [9ms] orbi_get_data() retrieved 520 records from the combination of file_info
(2) and status_log (520) via uidx
✔ [8ms] orbi_get_data() retrieved 17.8k records from the combination of
file_info (2) and scans (17.8k) via uidx
# compare
temps |>
  ggplot() +
  aes(
    x = time.min,
    y = temperature.C,
    color = temperature,
    linetype = data_source
  ) +
  geom_line() +
  facet_wrap(~filename, scales = "free") +
  scale_linetype_manual(values = c(3, 1)) +
  scale_color_brewer(palette = "Dark2") +
  labs(x = "time [min]", y = "temperature [°C]") +
  theme_bw()
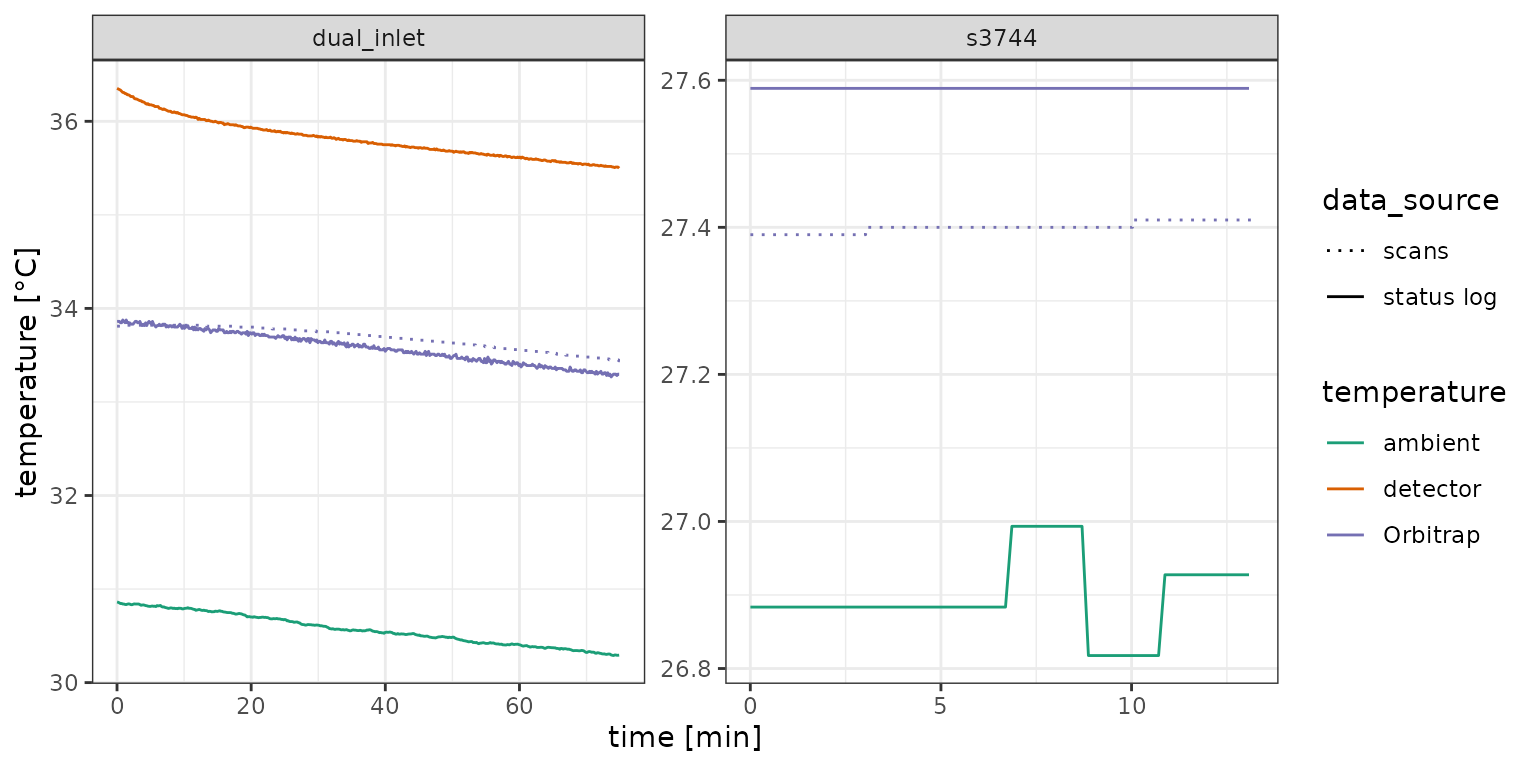
Temperatures recorded in the status log and the analyzer (Orbitrap) temperature recorded in the scans.

Temperatures recorded in the status log and the analyzer (Orbitrap) temperature recorded in the scans.